Google continually evolves its ranking algorithm, but few updates have generated as much conversation as the introduction of page experience signals. At the center of this evaluation sits core web vitals, a set of specific metrics that measure the speed, responsiveness, and stability of a webpage.
If you ignore these metrics, you risk losing valuable organic traffic to competitors who focus on optimizing technical performance.
This guide provides a comprehensive breakdown of how to measure, improve, and monitor these crucial signals. You will learn actionable strategies to enhance your website performance optimization and ensure your site meets the rigorous standards set by search engines.
What Are Core Web Vitals?
Core web vitals are a subset of user experience metrics that Google considers critical for all web experiences. They measure three distinct pillars of page experience: how fast content loads, how quickly the page responds to input, and how stable the layout remains while loading.
Each metric corresponds to a specific aspect of the user journey and has defined thresholds for success:
- Largest Contentful Paint (LCP): This measures loading performance. It marks the point in the page load timeline when the page’s main content has likely loaded.
- Interaction to Next Paint (INP): This measures interactivity. It observes the latency of all interactions a user has with the page throughout their visit. Note that INP has replaced First Input Delay (FID) as the primary responsiveness metric.
- Cumulative Layout Shift (CLS): This measures visual stability. It quantifies how much visible content shifts unexpectedly during the lifespan of the page.
Why Core Web Vitals Matter for SEO

Google explicitly uses core web vitals as part of its page experience signals. While content remains king, technical performance now acts as a tiebreaker in competitive search results.
Improving these metrics not only influences where you rank in search results; it fundamentally changes how users interact with your brand.
Optimizing for them directly impacts the following areas of your business:
- Rankings: Google uses these metrics as a confirmed ranking factor for both mobile and desktop search results.
- Bounce Rate: Users are far more likely to abandon a site that loads slowly or shifts unexpectedly.
- Conversions: A smoother, more responsive interface reduces friction, leading to higher conversion rates.
- Engagement: When users do not face frustration from technical errors, they stay longer and view more content.
It is important to distinguish core web vitals from other user experience metrics. While HTTPS security and mobile-friendliness are essential, they specifically target the technical execution of the code and server performance as experienced by the user.
How to Measure Core Web Vitals Accurately
You cannot improve what you do not measure, but accurate measurement requires understanding data sources, environments, and scoring logic. Simply running a single speed test will not provide the complete picture necessary for true website performance optimization.
Understanding Core Web Vitals Scoring Thresholds
Google has established a clear three-tier system to grade your performance. Do you know where your pages currently stand within this system?
To evaluate a page, Google looks at the 75th percentile of all page views. This means that if 75 percent of your users have a “Good” experience, the page is rated as “Good.”
| Metric | Good | Needs Improvement | Poor |
| LCP | ≤ 2.5s | 2.6s – 4.0s | > 4.0s |
| INP | ≤ 200ms | 201ms – 500ms | > 500ms |
| CLS | ≤ 0.1 | 0.11 – 0.25 | > 0.25 |
These thresholds apply to individual URLs. However, if a specific URL does not have enough data, Google may use aggregate data from the domain to estimate the score.
Field Data vs Lab Data (Critical Distinction)
One of the most confusing aspects of technical SEO is the difference between data collected from real users and data collected in a controlled environment. Which dataset should you trust when making optimization decisions?
Understanding the distinction between field data and lab data is vital for prioritizing your efforts.
| Aspect | Field Data | Lab Data |
| Data Source | Real users (Chrome User Experience Report) | Simulated environment (Lighthouse) |
| Accuracy | High (reflects reality) | Predictive (reflects potential) |
| SEO Impact | Direct ranking factor | Indirect (helps debugging) |
| Best Use Case | Monitoring ranking signals | Debugging specific issues |
Google rankings rely exclusively on field data because it reflects what users actually experience. Lab data helps you debug issues before you push code to production, but it cannot predict how a slow network or an old device will handle your site.
Measuring Web Vitals Using Search Console
Google Search Console offers the most accurate view of how Google sees your site’s performance. Are you utilizing the specific reports designed to highlight failing URLs?
This tool groups URLs with similar issues, allowing you to fix problematic templates rather than individual pages.
- Mobile vs. Desktop: The report splits data by device type. Since Google prioritizes mobile-first indexing, focus on the mobile report first.
- Grouped Issues: If one blog post fails LCP, likely all posts using that template fail. Search Console groups these for efficient troubleshooting.
- Validation: Once you apply a fix, you can click “Validate Fix” in Search Console to tell Google to recrawl those URLs.
Be aware that fixes take time to reflect in Search Console. Because the report relies on the last 28 days of user data, you may need to wait several weeks to see the status change from “Poor” to “Good.”
Common Measurement Mistakes to Avoid
Many site owners panic over poor scores because they measure their site incorrectly. Are you falling for one of these common pitfalls?
Avoid these errors to ensure you do not waste resources fixing non-existent problems.
| Mistake | Reality |
| One test is enough | Performance varies; trends matter more than single snapshots. |
| Desktop scores matter more | Mobile traffic usually dominates; Google ranks based on mobile. |
| Lab scores = ranking | Only field data from real users affects your search rankings. |
How Often Should You Measure Core Web Vitals?
Performance is not a “set it and forget it” task; it requires vigilance. Do you have a schedule in place to catch regressions before they hurt your traffic?
Regular auditing ensures you stay ahead of potential penalties.
- After Major Updates: Always audit immediately after deploying new design templates or features.
- Monthly Audits: Schedule a recurring check to review Search Console trends.
- Continuous Monitoring: For large enterprise sites, automated daily checks are necessary to track meaningful page experience signals.
Common Issues That Hurt
Identifying the symptom is the first step toward finding the cure. Can you match your site’s problems to these common technical deficiencies?
Use this table to quickly diagnose what might be dragging your scores down.
| Metric | Typical Issue | What It Looks Like |
| LCP | Slow server response times | The hero image or main headline takes seconds to appear. |
| LCP | Render-blocking CSS/JS | The screen stays white or blank while the code downloads in the background. |
| INP | JavaScript-heavy tasks | You click a button, but nothing happens for a noticeable moment. |
| CLS | Ads without a reserved size | Content jumps down suddenly when an ad banner loads at the top. |
Top Optimization Strategies
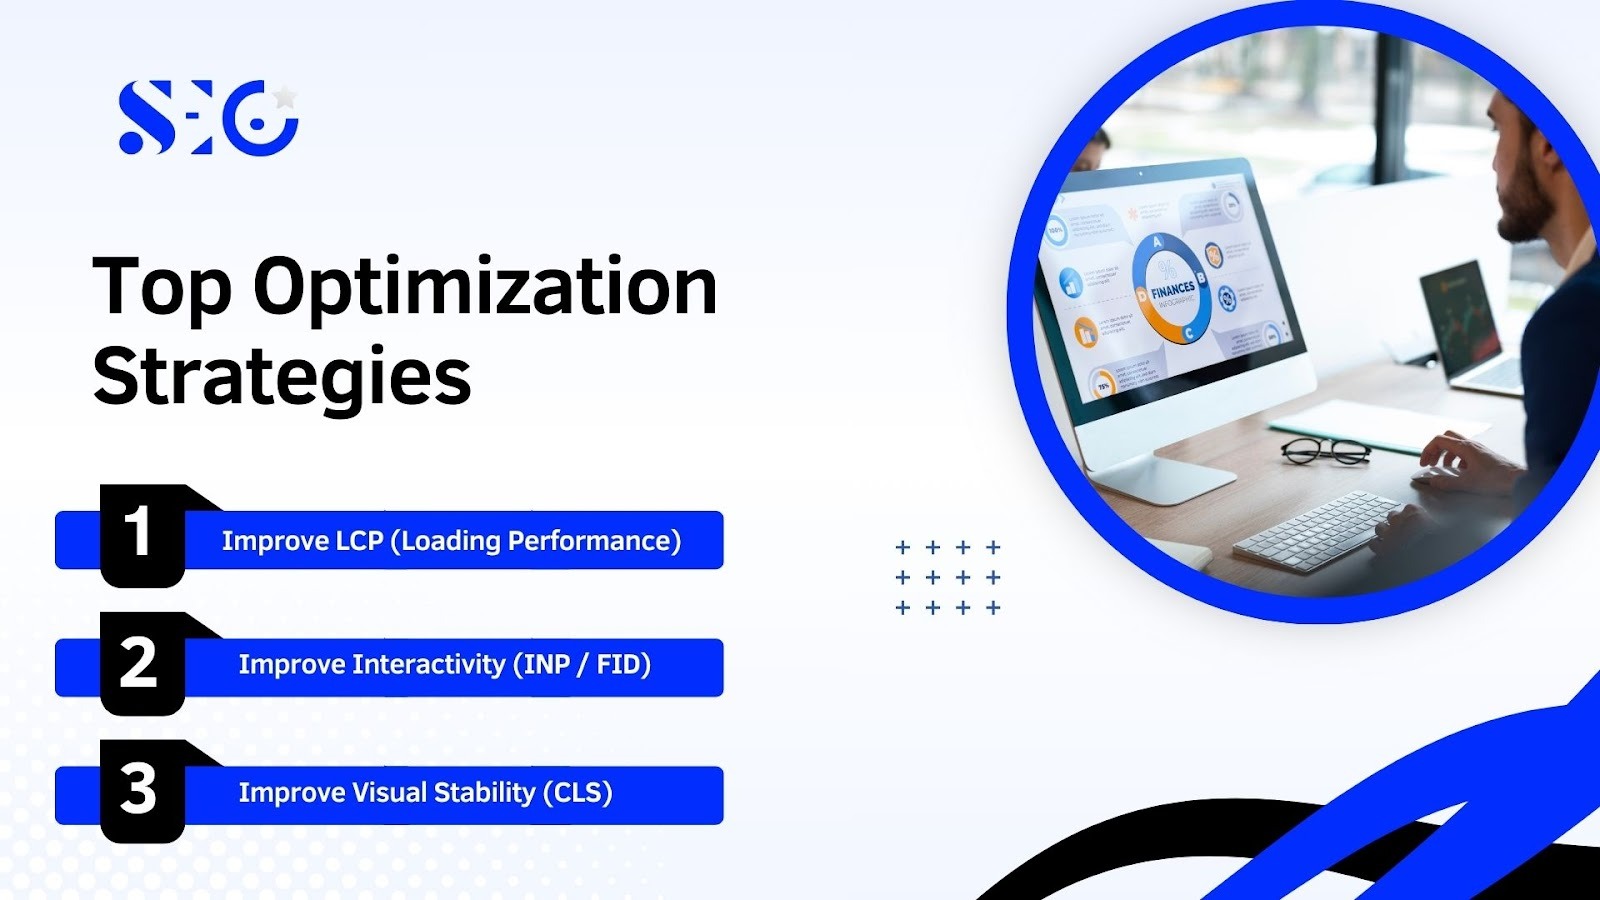
Now that you have diagnosed the issues, you must implement the solutions. This section breaks down practical technical fixes for each specific metric.
Improve LCP (Loading Performance)
LCP depends heavily on how fast your server responds and how efficiently your resources load. What changes can you make to the server and asset delivery to speed this up?
Focusing on loading performance requires a mix of server-side and client-side optimizations.
- Optimize Images: Compress all images and serve them in next-gen formats like WebP or AVIF.
- Preload Critical Resources: Use the <link rel=”preload”> tag for the LCP element (usually the banner image or H1).
- Use a Content Delivery Network (CDN): Serve assets from a server closer to the user’s physical location.
- Reduce Server Response Time: Implement server-side caching and optimize your database queries.
Improve Interactivity (INP / FID)
Interactivity issues almost always stem from too much JavaScript running on the main thread. Is your site trying to do too much calculation at the exact moment a user tries to click?
Freeing up the main thread allows the browser to respond instantly to user inputs.
- Break Up Long Tasks: Split long-running JavaScript tasks into smaller chunks so the browser can process user input in between them.
- Lazy Load Non-Critical Scripts: Do not load chat widgets or analytics scripts until the page has finished its initial load.
- Use Web Workers: Offload complex calculations to a background thread to keep the main interface responsive.
Improve Visual Stability (CLS)
Visual instability occurs when elements appear without defined dimensions. Are you allowing images and ads to push content around as they load?
Visual stability optimization is often the easiest metric to fix because it usually involves simple CSS changes.
- Specify Dimensions: Always include width and height attributes on images and video elements.
- Reserve Space for Ads: If you display dynamic ads, pre-allocate the space they will occupy using CSS so the content does not jump when the ad loads.
- Avoid DOM Changes: Do not insert new content above existing content unless triggered by a user action.
Integration With Website Performance Optimization
They do not exist in a vacuum; they function as part of a holistic performance strategy. Do you view these metrics as isolated numbers or as part of your overall site health?
Integrating these fixes enhances your broader website performance optimization efforts.
- Mobile Optimization: Ensure your site is responsive and lightweight for mobile networks.
- Caching: aggressive caching policies ensure returning visitors get near-instant load times.
It is also important to understand metrics like Time to First Byte (TTFB). While TTFB is not a core web vital, a poor TTFB makes it impossible to achieve a good LCP score.
Practical Example
To understand the real-world impact, let us look at a theoretical e-commerce site, “ShopFast.” ShopFast suffered from a high LCP of 4.2 seconds and a CLS of 0.3.
The Problem:
Users complained that product images loaded slowly and the “Buy Now” button moved just as they tried to click it.
The Fix:
- The team implemented WebP image conversion (improving loading performance).
- They added width and height attributes to all product images (improving visual stability optimization).
- They moved third-party tracking scripts to load after the main content.
The Result:
Within 28 days, LCP dropped to 2.1 seconds (Good), and CLS dropped to 0.05 (Good). Organic traffic to product pages increased by 15 percent, and the cart abandonment rate decreased significantly.
Tools and Resources Checklist
You do not need to guess; you need the right toolkit. Which of these industry-standard tools are you currently missing from your workflow?
Use this checklist to ensure you have full coverage.
- Google Search Console: Essential for monitoring field data and identifying specific URL groups failing Core Web Vitals.
- PageSpeed Insights: Provides a comprehensive mix of field and lab data alongside actionable optimization tips.
- Chrome User Experience Report (CrUX): The industry standard for accessing historical real-user experience data across millions of websites.
- WebPageTest: Best for deep-dive technical analysis, waterfall charts, and testing performance across different locations and devices.
- Lighthouse: An automated tool for local testing during the development process to improve page quality.
- DebugBear: Excellent for continuous monitoring and receiving alerts when your site’s speed or UX metrics regress.
- Layout Shift GIF Generator: A specialized tool to visualize exactly which elements are causing Cumulative Layout Shift (CLS).
- PurgeCSS: A must-have for developers to remove unused CSS, significantly reducing the main-thread work and improving load times.
Common Myths & Misconceptions
Misinformation spreads quickly in the SEO world. Are you basing your strategy on outdated or incorrect beliefs about performance?
Let us correct the record on a few persistent myths.
- “CWV only matters for desktop”: This is false. Mobile-first indexing means Google primarily looks at the mobile version of your site for ranking.
- “Any fast site has good CWV”: Not necessarily. A site can load quickly (good LCP) but still be frustrating to use if elements jump around (poor CLS). You need to balance speed with stability.
- “They are a one-time fix”: Performance regresses as you add new images, scripts, or content. It requires continuous monitoring and maintenance to stay in the “green.”
- “AMP is required for good Core Web Vitals”: You don’t need AMP to pass. Standard HTML and CSS can be just as fast, if not faster, when optimized correctly.
Conclusion
Optimizing for core web vitals is no longer optional for serious website owners. These metrics provide a direct line of sight into the quality of user experience you offer. By focusing on loading performance, interactivity, and visual stability optimization, you create a website that satisfies both Google’s algorithms and your human visitors.
Remember that they are just one part of the puzzle. They work in tandem with great content and solid technical foundations. Start measuring today, prioritize your fixes, and commit to continuous improvement.
Ready to elevate your online presence? Partner with SEO Pakistan for expert SEO services, including local SEO, and start climbing the ranks today.
Frequently Asked Questions
What is a good Core Web Vitals score?
A good score requires meeting the specific thresholds for all three metrics: LCP under 2.5 seconds, INP under 200 milliseconds, and CLS under 0.1. Failing even one of these moves puts the page out of the “Good” category.
Do core web vitals affect mobile rankings?
Yes, core web vitals are a significant ranking factor for mobile search results. Since Google uses mobile-first indexing, your mobile scores are arguably more important than your desktop scores.
How long does CWV optimization take?
The technical implementation can take days or weeks, depending on complexity. However, seeing the results in Google Search Console takes 28 days because the data is based on a rolling window of real user traffic.
Can plugins fix Core Web Vitals?
Plugins can help with specific tasks like image compression or caching, which improves LCP. However, plugins cannot fix everything, particularly deep-rooted issues like layout shifts caused by theme templates or complex JavaScript execution delays.
Is interaction to next paint more important than FID?
Yes, Google has replaced First Input Delay (FID) with Interaction to Next Paint (INP) as the primary responsiveness metric. INP provides a more comprehensive view of interactivity because it measures all interactions, not just the first one.